One of the most common reasons we want to look at metrics is so that we can more accurately answer the question “when will we be done?” With those metrics, we can create a probabilistic forecast that answers that question based on historical data.
Single item forecasting
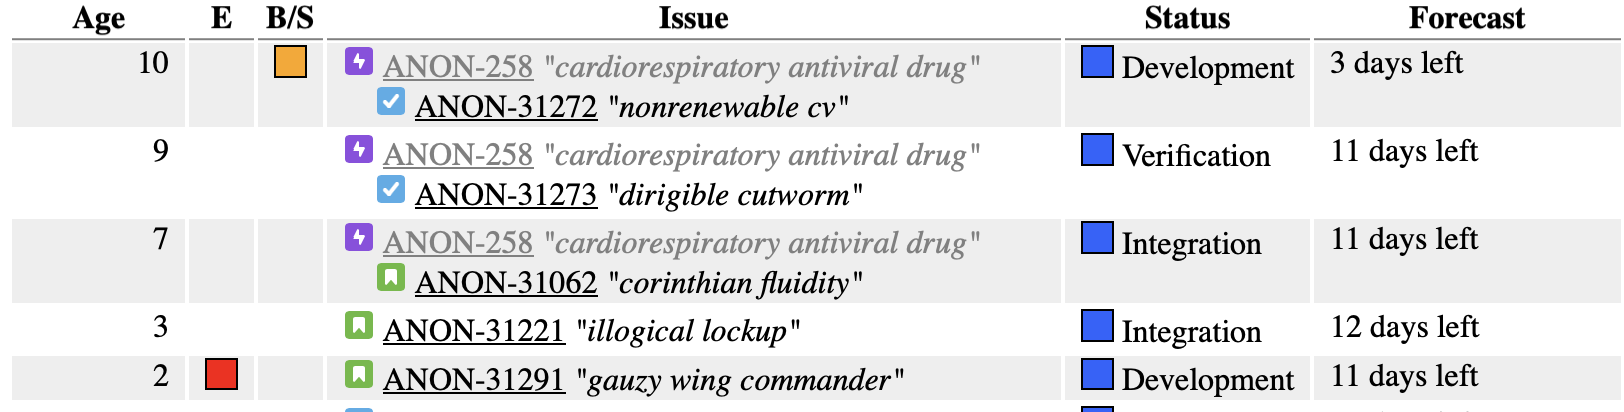
JiraMetrics can generate a single-item forecast for items that are already in progress. You can see this on the Aging Work Table, where the forecast column will show you how many days are likely remaining. If a forecast can’t be generated then an error will be shown with the details of why that is.
Monte Carlo forecasting
Although JiraMetrics doesn’t create a monte carlo forecast for you, it can easily extract the data you need to do a forecast in tools like Actionable Agile (commercial) or the Focused Objective throughput forecaster (free).
If you haven’t used JiraMetrics before then you’ll likely want to start with the QuickStart and then you can come back here for the configuration to help with probabilistic forecasting.
To use the Focused Objective spreadsheet, you’ll need only the throughput data across multiple weeks and you can easily get that by looking at the throughput_chart.
Using Actionable Agile is a little trickier as it requires more data in a specific format but even this isn’t hard. The configuration below will generate exactly what you need. Note that only the part within columns is specific to this output. The rest is only provided for context.
Exporter.configure do
  timezone_offset '-05:00'

  target_path 'target/'
  jira_config 'jira_config_improvingflow.json'

  project name: 'myproject' do
    file_prefix 'myproject'

    download do
      rolling_date_count 90
    end

    board id: 1 do
      cycletime do
        start_at first_time_in_status_category('In Progress')
        stop_at still_in_status_category('Done')
      end
    end

    discard_changes_before status_becomes: :backlog # 'To Do'

    file do
      file_suffix '.csv'

      columns do
        write_headers true

        string 'ID', key
        string 'link', url
        string 'title', summary
        column_entry_times
      end
    end
  end
end